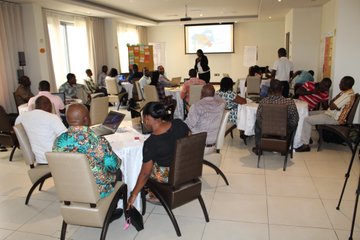
Mobile Web Ghana, under its open data project, Code for Ghana, has always demonstrated a profound seriousness in building the capacity of Ghanaians in data analysis and visualization. Over the years, we have organized a number of events to train data enthusiasts in data analysis and how to use some easy-to-use software. The goal is to have as many professionals consciously analysing data and deriving insights from their analysis that will inform decisions that are made in various institutions all over the country.
In the past years, we focused on people in the tech community mainly in Accra, although some of our events have attracted people from outside the capital city of Ghana. We have held hackathons, forums, workshops etc. either at our training lab in North Legon or in some other location in Accra. On some occasions we are invited to train some members of staff of some government institutions in their offices. This year we had the opportunity to go beyond the borders of Accra to conduct training sessions in every region in Ghana. This project, ‘Data reporting for the SDGs’, was sponsored by the GIZ under their Agenda 2030 program. Our team of facilitators traveled to all the regions in Ghana together with other facilitators and the GIZ team to train members of staff of Municipal Metropolitan and District Assemblies (MMDAs), Civil Society Organizations (CSOs) and Media Houses (journalists). The project started on 20th June in the Central Region and ended on 8th November, 2019 in the Upper West Region. At the end of the project, we trained more than 500 professionals on how to report on the SDGs using data analysis and visualization.
In the first 2 months of this year, the team together with GIZ, the project partners, were in the Volta Region to pilot the project. After the pilot, the team learnt so many lessons that would later influence the manner in which the project would be conducted for the rest of the country. One of the most prominent lessons learnt from the pilot was that the participants gravitated towards the less sophisticated software than they did to the other ones. Hence, we made it a point to stick to simple data analysis and visualization tools like Microsoft Excel, Microsoft PowerPoint and Canva. Excel and PowerPoint are both included in the Microsoft Office suite, hence anybody who owns a PC automatically has access to them. While other data analysis and visualization software require download and installation, these ones come preinstalled on the computer. Canva is also quite easy to use and most of the trainees testified to the diverse infographic designs they were capable of developing with Canva. Hence, introducing the trainees to these software ignited in them the necessary passion to pursue data analysis and visualization even to a higher level than we brought them to. First of all, because they could easily use the software we introduced to them, they could see the essence of the training. Secondly, we reiterated the fact that the training was just an introduction to a broad field and we left them with enough links and resources to enable them to do further studies.


Pictures from the various training sessions all very country
The 3 categories of participants we had during the training program all have different relationships with data and reporting on them. The MMDAs are known to collect data in the districts they work in. The CSOs need data to know the extent of the problems they are dealing with and also to track the progress they are making in specific areas. The Journalists also need data to report accurately on issues on the ground and to keep their audiences informed. This is why it was essential to train these 3 categories of professionals to make the desired impact. The goal is to see data analysis and visualization incorporated in the reporting on the SDGs. Therefore, the facilitators did well to stress the need for collaboration among these three categories of professionals. The journalists and the representatives of CSOs need data from the MMDAs. The MMDAs also need the help of some CSOs to achieve their goals in the communities. The MMDAs and CSOs need journalists to tell their stories and broadcast them to a wider audience to ensure that Ghanaians are informed about their impact which may lead to them gaining access to sources of funding. There is a profound relationship of interdependence that exists between these three hence having all of them present at the same training program was a step in the right direction to engender collaboration.
We were very glad to be part of this project. It was an eye-opening experience for us. It made us better appreciate the skills gap that exists in the corporate world (both government and private institutions) and how capacity building programs such as these are important. The feedback we got from the participants were overwhelming and humbling. Many of them asked that we do these kinds of training programs regularly and more extensively. Also, the biggest feedback we got was the visible impact we made in the professional lives of the many people we trained. Some of them had already started making use of their newly acquired skills at their places of work. They had already started reporting differently and analysing their data. From time to time, they send us their visualizations for feedback and also as proof that our toil was not in vain. Find a few of such infographics designed by the trainees of this project below:
In general, the project was successful. The participants were very eager to learn and participate in every activity that the facilitators asked them to do. It was very encouraging to see their dedication and commitment to the cause of helping Ghana achieve the SDGs. They intimated how helpful the data analysis training sessions were to them and how they were going to use the newly acquired knowledge and skills in their daily work.


